
Table of Contents
- Solar Farm Costs in 2025: Current Market Overview
- Detailed Cost Breakdown: Where Your Investment Goes
- Key Factors Affecting Solar Farm Construction Costs
- ROI and Profitability Analysis
- How Grace Solar Solutions Optimize Your Project Costs
- Global Cost Comparison by Region
- Future Cost Trends and Predictions
Solar Farm Costs in 2025: Current Market Overview
Understanding solar farm construction costs is crucial for investors, developers, and landowners considering renewable energy projects. Based on current market data from SEIA and industry reports, utility-scale solar farm costs range from $0.80 to $1.36 per watt, making solar energy increasingly competitive with traditional power sources. The global weighted average levelized cost of electricity (LCOE) for utility-scale solar photovoltaics has declined by 87% since 2010, reaching $0.043 per kWh in 2024.
For a typical 1MW solar farm, total installation costs typically range from $800,000 to $1,360,000, excluding land acquisition. Community solar projects (1-5MW) generally fall in the middle of this range, while larger utility-scale installations benefit from economies of scale. It's important to note that these figures represent turnkey costs including engineering, procurement, construction, and grid connection.
The declining cost trend continues through 2025, driven by technological improvements, manufacturing scale, and increased competition in the solar supply chain. According to the latest IRENA reports, solar PV module prices have decreased by approximately 15% year-over-year, contributing significantly to overall project cost reductions.
Quick Cost Reference Table
| Project Size | Total Cost Range | Cost per Watt | Land Required | Typical Payback Period |
|---|---|---|---|---|
| 1MW Community Solar | $890,000 - $1,010,000 | $0.89 - $1.01 | 6-8 acres | 8-10 years |
| 5MW Utility Scale | $4,000,000 - $6,000,000 | $0.80 - $1.20 | 25-40 acres | 7-9 years |
| 50MW Large Utility | $38,000,000 - $60,000,000 | $0.76 - $1.20 | 250-400 acres | 6-8 years |
| 100MW+ Mega Projects | $70,000,000 - $110,000,000 | $0.70 - $1.10 | 500-800 acres | 5-7 years |
Detailed Cost Breakdown: Where Your Investment Goes
Equipment Costs (60-75% of Total)
Solar panels represent the largest equipment expense, typically accounting for 30-40% of total project costs. Inverters, mounting systems, and electrical components make up the remainder. The choice of mounting systems significantly impacts both initial costs and long-term performance. High-quality mounting systems from established providers like Grace Solar can reduce installation time and maintenance costs while ensuring structural integrity over the 25+ year project lifespan.
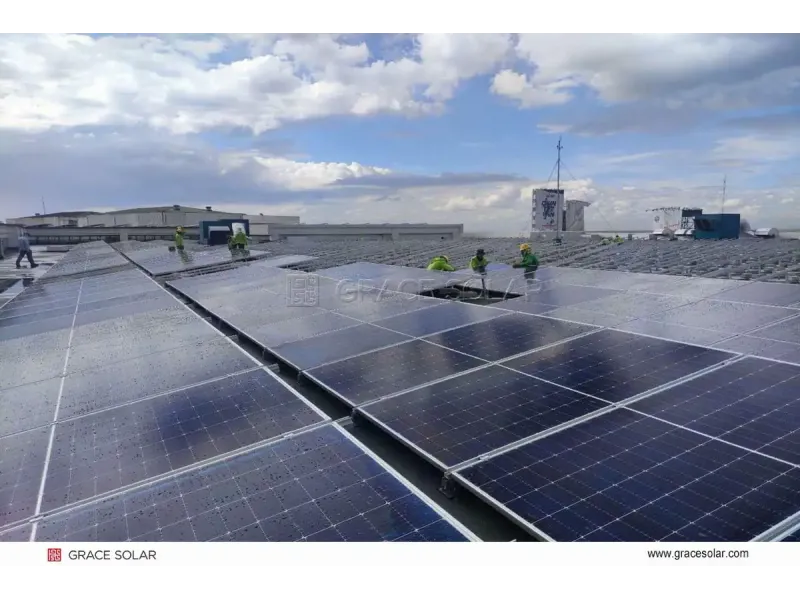
Installation & Labor (15-25% of Total)
Professional installation costs range from $50-150 per hour, depending on project complexity and region. This includes site preparation, mounting system installation, electrical work, and grid connection. Labor costs vary significantly by geography, with developed markets like the United States and Western Europe commanding premium rates compared to emerging markets. Efficient project management and experienced installation teams can reduce labor costs by 15-20% through optimized workflows.
Soft Costs (10-20% of Total)
Permitting, engineering design, interconnection applications, and financing costs typically account for 10-20% of the total budget. These vary significantly by location and regulatory environment. Soft costs have become an increasingly important focus for cost reduction, with digital tools and standardized processes helping to streamline development timelines. Projects in jurisdictions with streamlined permitting processes can see soft costs at the lower end of this range.
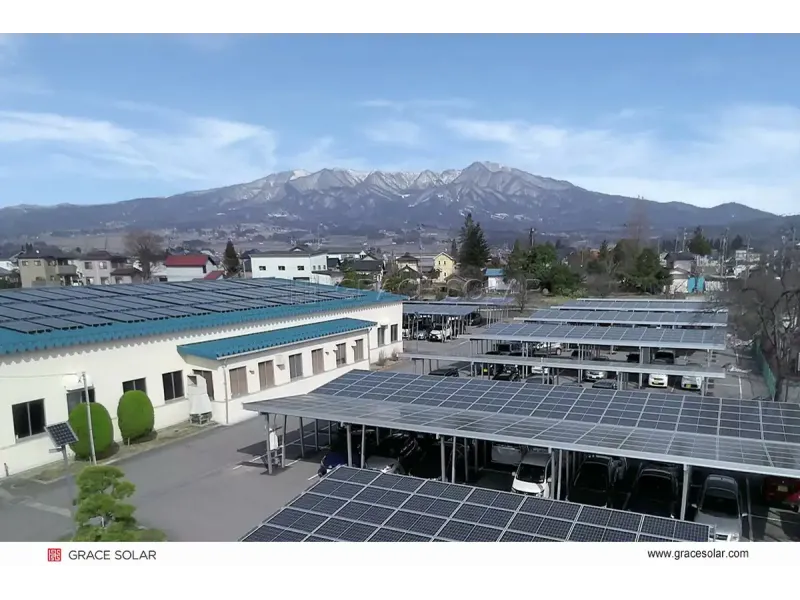
Land Acquisition and Site Preparation (5-10% of Total)
Land costs vary dramatically by location, ranging from $1,000 to $5,000 per acre annually for lease agreements. Site preparation including grading, drainage, fencing, and access roads typically adds $10,000 to $50,000 per megawatt depending on terrain complexity. Projects on previously developed or marginal agricultural land often benefit from lower preparation costs and faster permitting timelines.
Key Factors Affecting Solar Farm Construction Costs
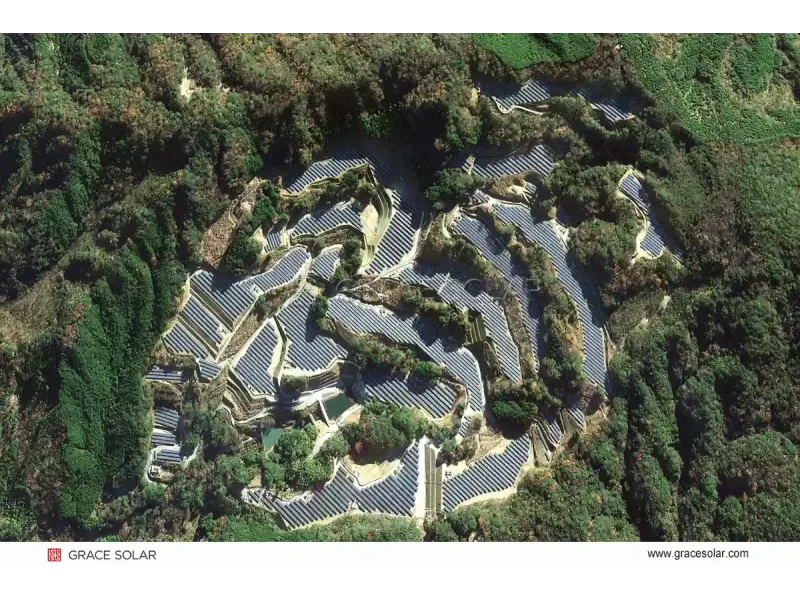
Project Scale and Location
Larger projects benefit from economies of scale, reducing per-watt costs. Geographic location affects labor rates, permitting requirements, and solar irradiance levels, which influence energy production and revenue potential. Projects in high-irradiance regions like the American Southwest, Middle East, and Australia typically achieve higher capacity factors, improving project economics even at slightly higher installation costs.
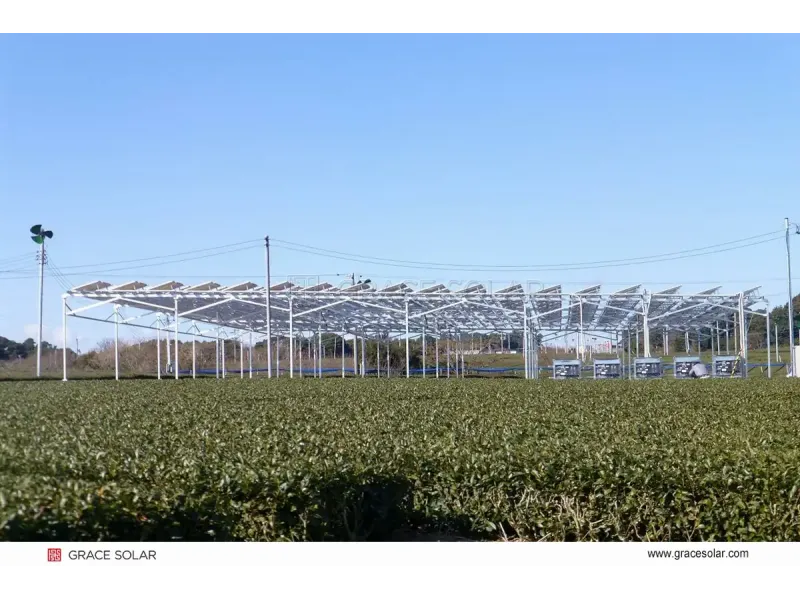
Mounting System Selection
The choice between fixed-tilt and tracking systems significantly impacts both initial investment and long-term energy generation. Tracking systems can increase energy production by 15-25% but come with higher upfront costs and maintenance requirements. Advanced mounting solutions like Grace Solar's GS-Light intelligent tracking system offer optimized performance with reduced maintenance needs, providing better lifetime value despite higher initial investment.
Grid Connection and Infrastructure
Proximity to existing transmission lines and substations can substantially affect costs. Remote locations may require extensive grid upgrades, adding millions to project budgets. Interconnection studies, transformer upgrades, and transmission line extensions can represent 5-15% of total project costs. Early engagement with grid operators and careful site selection are crucial for managing these expenses.
Technology and Efficiency Choices
The selection of panel technology (monocrystalline vs. polycrystalline vs. thin-film), inverter type (central vs. string vs. microinverters), and whether to include energy storage all impact project costs. High-efficiency monocrystalline panels typically command a 10-15% premium but can reduce balance-of-system costs through higher energy density. Battery storage systems add $200-400 per kWh but can significantly increase project revenue through energy arbitrage and grid services.
ROI and Profitability Analysis
Well-designed solar farms typically achieve payback periods of 7-12 years, with operational lifespans exceeding 25 years. A 1MW solar farm can generate annual revenues of $40,000-$100,000, depending on local electricity rates and solar resources. Projects with power purchase agreements (PPAs) typically achieve internal rates of return (IRR) of 8-12%, while merchant plants (selling directly to wholesale markets) may achieve higher returns with correspondingly higher risk.
Financial Incentives and Tax Benefits
The federal Investment Tax Credit (ITC) currently offers 30% tax credit for solar projects, significantly improving ROI. Additional state incentives, accelerated depreciation, and renewable energy credits can further enhance project economics. Many jurisdictions also offer property tax abatements, sales tax exemptions, and production-based incentives that can improve project returns by 15-25%. The modified accelerated cost recovery system (MACRS) allows for 5-year depreciation of solar assets, providing substantial tax benefits in the early years of operation.
Operations and maintenance costs typically range from $10-50 per kW annually, representing 1-2% of initial investment per year. These costs include panel cleaning, vegetation management, inverter maintenance, and system monitoring. Regular maintenance is essential for preserving system performance and maximizing energy production throughout the project lifecycle.
How Grace Solar Solutions Optimize Your Project Costs
With over 10 years of industry experience and ranking among the top 5 in global market share, Grace Solar brings proven expertise to solar farm development. Our cumulative 48GW of global installed capacity demonstrates our capability to deliver cost-effective, reliable solutions. We understand that optimizing project economics requires attention to both initial costs and long-term performance.
Advanced Mounting System Technologies
Our GS-Light intelligent tracking system and GS-Smart ground mounting systems are engineered to maximize energy production while minimizing installation time and maintenance costs. With over 100 patents, we offer innovative solutions that reduce lifetime project costs. The GS-Light tracker incorporates AI-driven optimization to maximize energy capture while minimizing mechanical stress, extending system lifespan and reducing maintenance requirements by up to 30% compared to conventional trackers.
Global Experience, Localized Solutions
Having successfully completed projects in over 100 countries, Grace Solar understands the unique cost considerations of different markets. Our products carry UL, TUV, CE, JIS, and MCS certifications, ensuring compliance with local regulations and reducing approval timelines. Our regional engineering teams provide site-specific designs that account for local wind, snow, and seismic conditions, avoiding over-engineering while maintaining structural integrity.
Comprehensive Project Support
From initial site assessment through commissioning, Grace Solar provides end-to-end support. Our team of experienced engineers works closely with developers to optimize system design, select appropriate components, and streamline installation processes. We offer value engineering services that have helped clients reduce balance-of-system costs by 12-18% without compromising quality or performance.
Supply Chain Efficiency and Quality Assurance
With an annual production capacity of 15GW and vertically integrated manufacturing processes, Grace Solar maintains strict quality control while optimizing production costs. Our global logistics expertise ensures timely delivery to project sites worldwide, preventing costly construction delays. All our mounting systems undergo rigorous testing in our 2000m² experiment center, validating performance under extreme environmental conditions.
Global Cost Comparison by Region
Solar farm construction costs vary significantly by region due to differences in labor rates, regulatory environments, supply chain development, and local market conditions. Understanding these regional variations is crucial for accurate project budgeting and investment decisions.
Regional Cost Variations (per watt)
- United States: $0.95 - $1.36/W (higher in Northeast and California, lower in Southwest)
- China: $0.60 - $0.85/W (benefiting from domestic manufacturing and streamlined permitting)
- India: $0.55 - $0.80/W (competitive labor costs and growing domestic supply chain)
- European Union: $0.90 - $1.30/W (higher in Western Europe, moderate in Eastern Europe)
- Australia: $0.85 - $1.20/W (moderate labor costs with excellent solar resources)
- Middle East: $0.70 - $1.05/W (competitive projects with large-scale tenders)
- Latin America: $0.75 - $1.15/W (varying by country and regulatory stability)
These regional differences highlight the importance of localized expertise and supply chain partnerships. Grace Solar's global presence enables us to provide region-specific cost optimization strategies, leveraging our experience across diverse markets to deliver optimal solutions for each project location.
Future Cost Trends and Predictions
The solar industry continues to experience rapid technological advancement and cost reduction. According to industry projections, utility-scale solar costs are expected to decline by an additional 15-25% by 2030, reaching as low as $0.50-0.80 per watt in optimal markets. Several key trends are driving this continued cost reduction:
Technology Innovation
Emerging technologies including bifacial panels, perovskite solar cells, and advanced tracking systems are increasing energy yield while reducing balance-of-system costs. Improvements in panel efficiency are reducing land requirements and structural costs per megawatt. Grace Solar's ongoing R&D investments in our GS-Light tracking system and smart mounting solutions are focused on delivering these efficiency gains to our clients.
Manufacturing Scale and Automation
Expanding global manufacturing capacity and increased automation are driving down component costs. The solar industry is moving toward greater standardization and prefabrication, reducing installation time and labor requirements. Grace Solar's automated production facilities and standardized component systems contribute to these cost reduction trends while maintaining quality standards.
Soft Cost Reduction
Digital tools, streamlined permitting processes, and standardized contracts are reducing development timelines and soft costs. Many jurisdictions are implementing automated permitting platforms and pre-approved system designs to accelerate project development. Grace Solar's digital design tools and certification portfolio help clients navigate these processes efficiently.
Key Takeaway
While solar farm construction requires significant upfront investment, current technology and incentives make projects financially viable with attractive returns. Partnering with experienced providers like Grace Solar can optimize costs, enhance system performance, and ensure long-term project success through reliable mounting solutions and comprehensive technical support. The continued downward trend in solar costs, combined with improving efficiency and supportive policies, makes solar farm development an increasingly attractive investment opportunity with strong potential for long-term returns.


